At the end of January, it looked like we had all the information about the business of online games for 2017 that we were going to get. So imagine our surprise when a ton of new data was dropped in our lap at the end of April. I’m a big fan of r/dataisbeautiful so I squealed in joy as it meant that it was time for a part 2. Up ahead you’ll see a lot of infographics and a lot of data as we look at 2017 games industry by the numbers.
The infographics used in this article were created by NewZoo and Filmora. The data was collected by NewZoo, Business Insider, and a number of esports dedicated sites. To make it easier to read we’ve broken the larger infographics up into individual segments. Not only does this make it easier to look at the data it means we can talk about each part one at a time.
Number of Gamers Worldwide
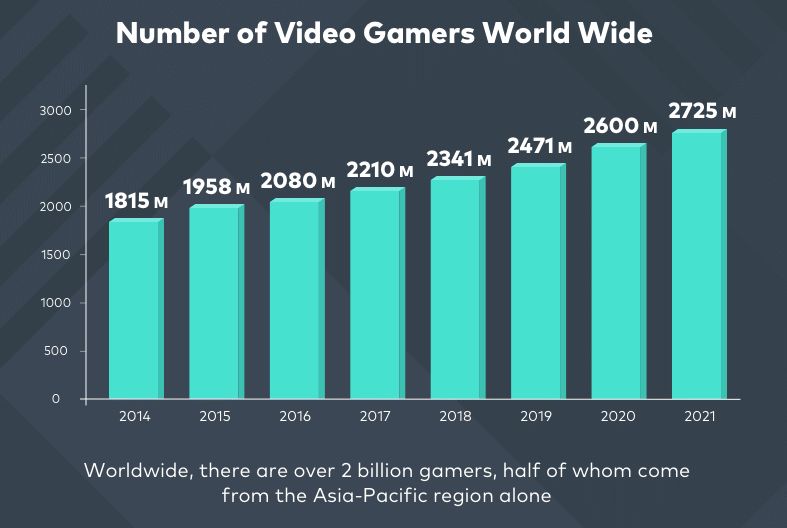
There are over 2 billion gamers around the world, a number that has been climbing every year. Half of those two billion gamers come from the Asia-Pacific region alone. In 2018 it is anticipated that there will be 2,341 million gamers. By 2021 that number will go up by nearly 400 million people.
Top Countries by Revenue
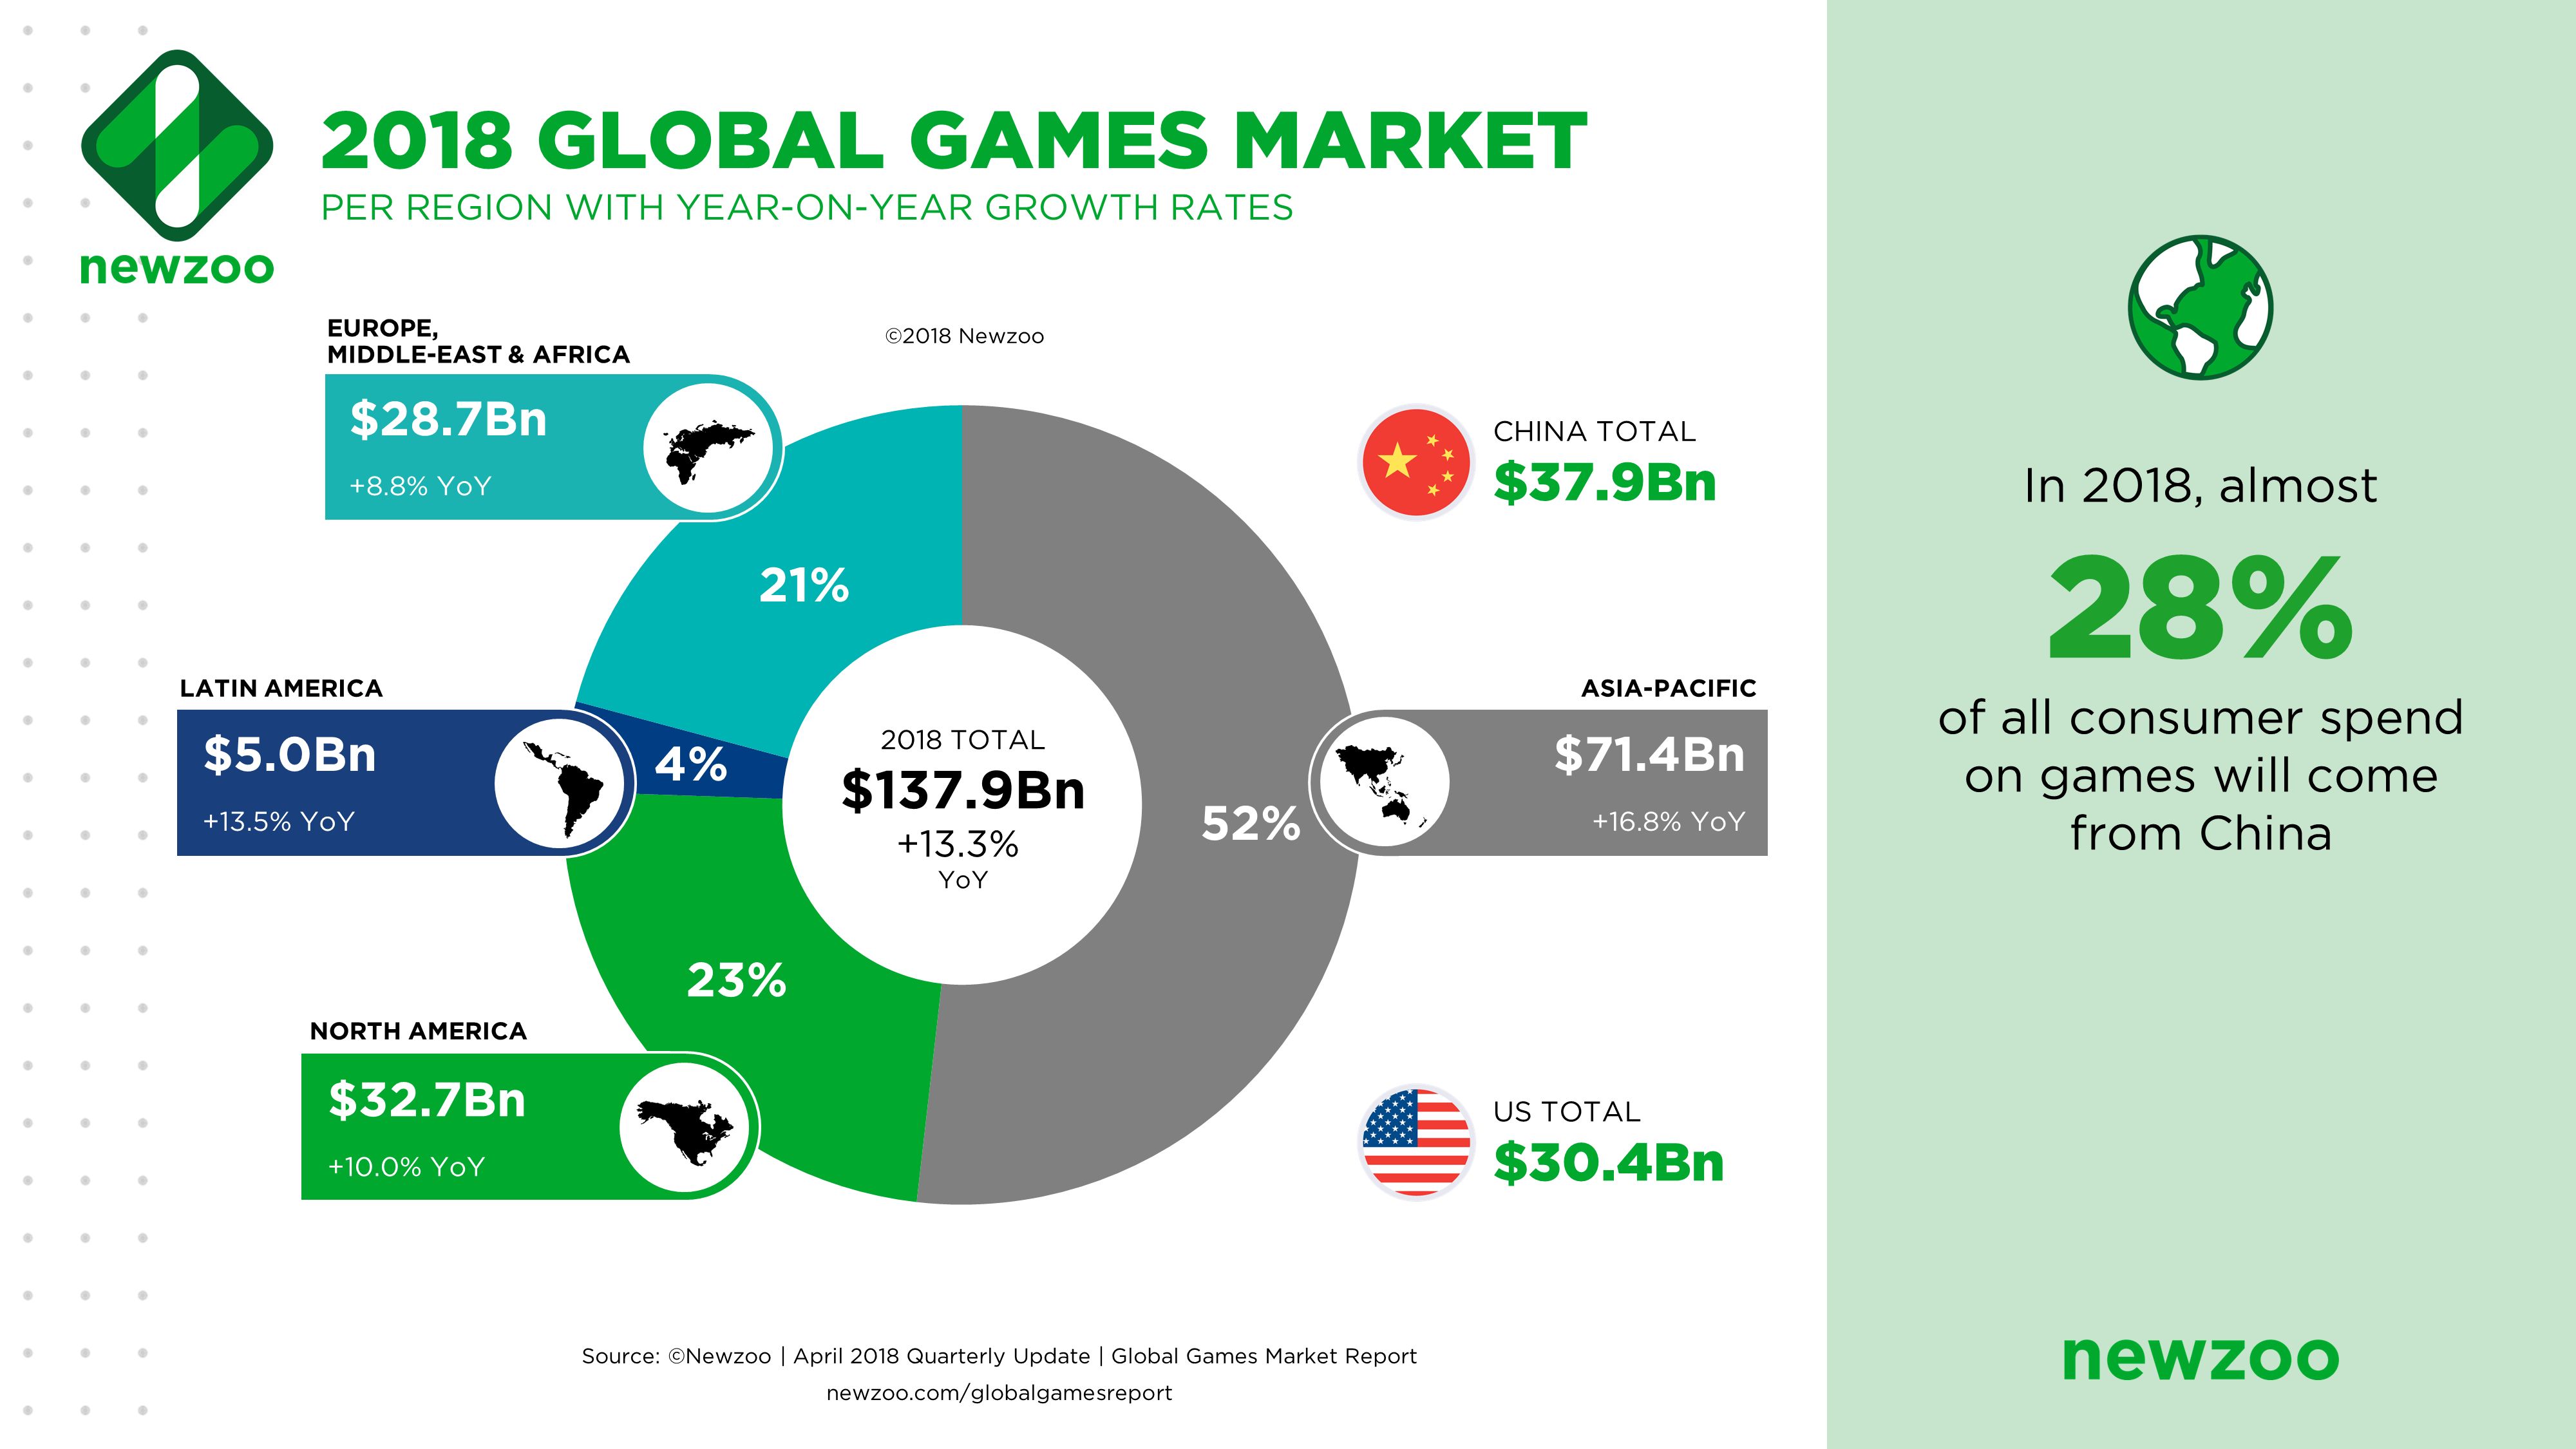
As stated above, the Asia-Pacific region accounts for more than half of the global gaming market (52% to be exact). That’s $71.4 billion just from that market. It’s anticipated that in 2018 China will account for 28% of all consumer spending on games. A majority of the spending in the Asia-Pacific region is in mobile gaming. Newzoo is anticipating that the mobile market in that region will go up $9.7 billion in 2018. North America is the next highest and the growth in that market has also been mostly driven by mobile games. While we do see the same trends in Europe, all told Europeans are less likely to spend any money on mobile games than North Americans who spend 1.6 times the amount on average.
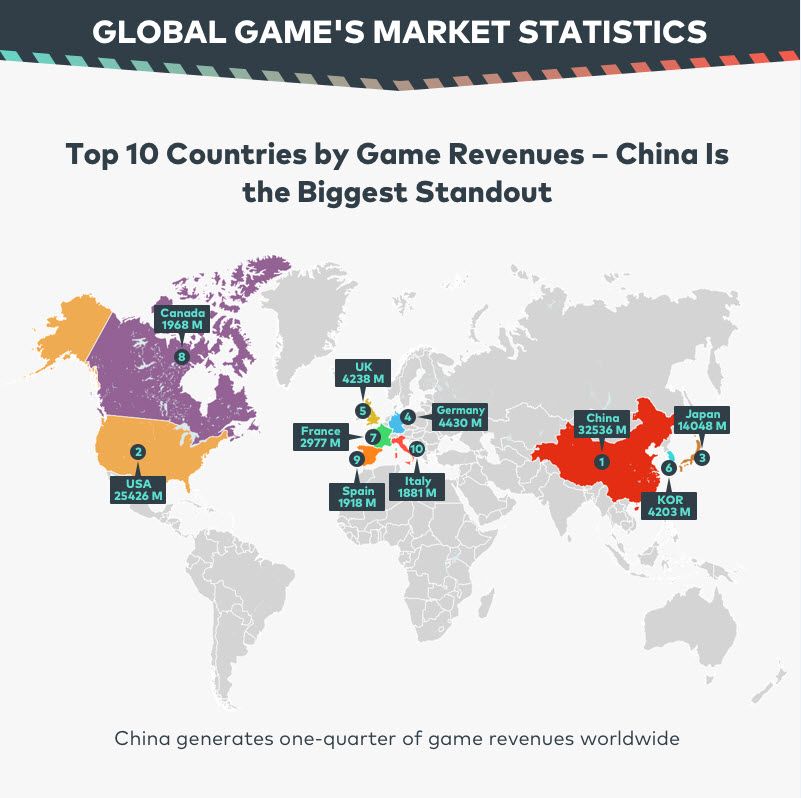
Looking at individual countries we can clearly see that China stands out above the rest. In the number two spot is the United States, followed up by Japan. Japanese gamers, however, actually spend more on mobile games. The Japanese mobile game market is nearly the same size financially speaking as North America, however, it is working with about one-third of the number of gamers. The average spent per player in Japan is 1.5 times higher than North America and 2.5 times higher than in Western Europe. In Europe, Germany and the UK both stand out above the other countries in the region.
Who is Playing
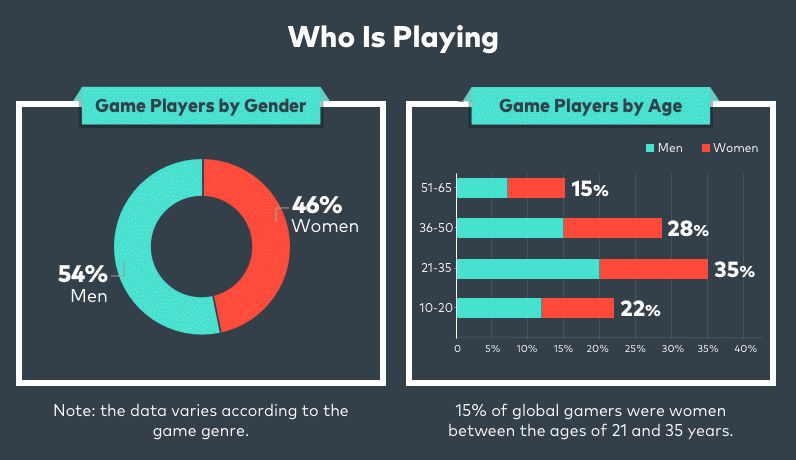
It’s also interesting to see who is gaming broken down by gender and age. Gaming has for a long time been considered a form of entertainment meant for boys and men. But with 46% of the market being made up of women, it’s clear this isn’t the case at all anymore. As you might expect, this number varies greatly depending on the genre, but that’s something we’ll dive into in the next segment down. The 21 to 35-year-olds make up the largest demographic by age with 35% of players falling into that category. In fact, 15% of all gamers are women between the ages of 21 and 35. Surprisingly the 51-65 age range also makes up 15% of all gamers. This number is a lot higher than you would anticipate. But mystery games and puzzle games are very popular with this older demographic. Also, the advent of games like Pokemon Go, which they can share with their kids and grandkids, means older people are getting into gaming to bond with their family.
What Kinds of Games do they play

That brings us now to the question of what types of games are being played broken down by gender and by platform. Unfortunately, this section has a typo that is repeated several times and every time I look at it this is all I can see, GAH! Anyway, moving on to the data…
It’s clear that men and women have vastly different tastes when it comes to games. Sports appear in the top three for men on console and mobile while it isn’t anywhere to be seen for women. On the other side, arcade games appear on the chart for women in console and mobile and don’t make the list for men at all. Strategy games are the one area that brings, almost, all of us together. The only area they don’t make the list is for men on consoles. On the whole, women prefer a wider variety of games than men. Men only have 4 different genres on the list compared to women with 5. Shooters, which make the top 3 for every platform for men don’t make the list at all for women.
Women prefer more casual games on mobile than men. Puzzle and Arcade both being on the list suggests that they’re looking for fun, easy to play games. The type that you can play a level then go about your business and come back to when you have the time.
It’s also interesting to see that sports games don’t make the list for PC while they do for mobile and console for men. First, there’s the fact that very few sports games are released on PC. The last major sports game released on PC was in November. While other platforms have 22 sports titles released since then. But that only tells part of the story. If you go to Steam you’ll find tons of sports titles, but most of them aren’t very well known and come from indie studios. Sports games have never done particularly well on PC and maybe that has something to do with the people who own them rather than the games themselves.
We’re actually only about 1/3 of the way through all the data at this point. I don’t know about you, but I need a break and a bit of a breather before we keep going with more. So keep a look out for part 3 where we’ll look at the top companies by revenue, the best selling games, and more. Then the final portion will be focused on esports.
Related: Column, Filmora, Industry, MMO, MMORPG, NewzooRelated: Business
Comments
Post a Comment